
HinshieBluenose
Well-Known Member
A bout of insomnia has me creating graphs at 2am! I'm pretty sure that the data is correct having checked it against info on wiki but if there is a glaring error please let me know. I should mention that I added our deducted points back on for the 2011/12 season. The outer bars on the horizontal show the points at the 20 game mark and the inner bars show the points by the end of the season.
It shows we have had our best points return after 20 games, in the premiership, for the past two decades. Personally, I think the tally this season will be very similar to 2001/02, in our favour this time of course.
[url=https://postimg.cc/K4HXB5Fr]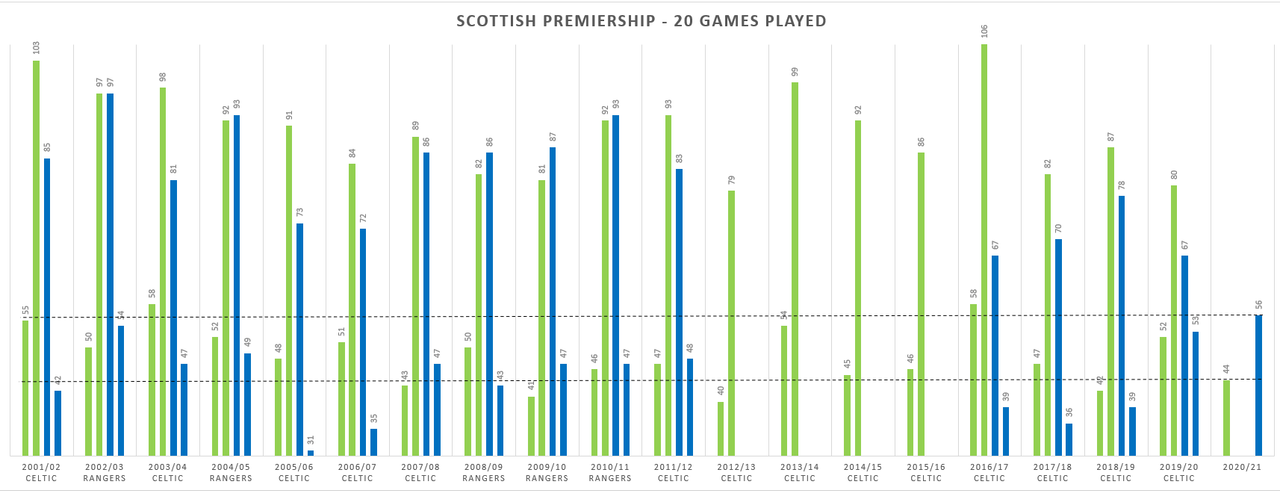 [/URL]
Edit: You should be able to open image in new tab, to see the graph in more detail, by right clicking the graph and selecting that option. If you get an error, you can save the image and view it that way.
It shows we have had our best points return after 20 games, in the premiership, for the past two decades. Personally, I think the tally this season will be very similar to 2001/02, in our favour this time of course.
[url=https://postimg.cc/K4HXB5Fr]
 [/URL]
Edit: You should be able to open image in new tab, to see the graph in more detail, by right clicking the graph and selecting that option. If you get an error, you can save the image and view it that way.
Last edited:


")
)")
")


